Reading a reactivity graph
Probing antibody repertoires with mid-range peptide libraries (n=103 - 104) as microarrays yields data that can also be presented as a graph of cross-reactivities. “Cross-reactivity” here is detected by measuring the correlation between the binding profiles across serum samples from individuals (usually grouped by diagnosis)(1). Obviously, thus measured, the cross-reactivity is related to a set of reactivities found in the patients studied with respect to the peptide library used. The IgM reactivities to known self and viral tumor (associated) antigens in patients with brain tumors(1) showed a much more pronounced correlation with ABO blood group than in patients with neurodegenerative diseases, as probed with an optimized IgM IgOme library(2).
More caveats
Let \(Y\) be probes \(\times\) donors. Serum \(j\) contains latent antibody clones at concentrations \(C_{kj}\), and clone \(k\) binds probe \(i\) with strength \(W_{ik}\), so \(Y\approx WC+E\) and
\[\Sigma\;=\;W\,\mathrm{Cov}(C)\,W^{\!\top}+\Psi .\]
Here, (i) A supra‑threshold correlation will be produced also by two distinct antibodies whose concentrations co‑vary across donors, The dominance of blood‑group structure in \(v_2\), discussed below, may be related to this. (ii) Thresholding a covariance‑like matrix yields a union of cliques, one per latent factor with large loadings. “Highly connected graph with motif‑like clusters” is also what a low‑rank \(W\) looks like after thresholding, so community structure here is rather a factor structure. The “cross-reactivity” graph actually measures groups of reactivities that change in parallel across the repertoire. This includes cross-reactivity but also suggests coordinated regulation, shared antigen source, or convergent selection. Our cross-reactivity graph does not differentiate yet between these factors.
The correlation threshold is calibrated by ROC against mimotopes grouped by the panning monoclonal that selected them. Those groups share sequence motifs so the ROC measures how well correlation recovers motif similarity. This compels us to declare another caveat of his approach - we measure “cross-reactivity” based on motif similarity, but miss cross-reactivity between unrelated sequences.
The graph, briefly
Nodes are reactivities (mimotopes, or microarray features); edges here encode a supra threshold correlation between the profiles. Write the adjacency matrix \(A\) and degree matrix \(D\). The combinatorial Laplacian
\[ L \;=\; D - A \]
has eigenpairs \(L\,\mathbf{v}_k = \lambda_k\,\mathbf{v}_k\) with \(0 = \lambda_1 \le \lambda_2 \le \dots\). The smallest non-trivial eigenvectors give a low-dimensional embedding in which graph structure becomes geometric — the coordinate system we then feed to UMAP (itself using spectral clustering) for visualization.
Blood Group Reactivity Correlation Sometimes Dominates
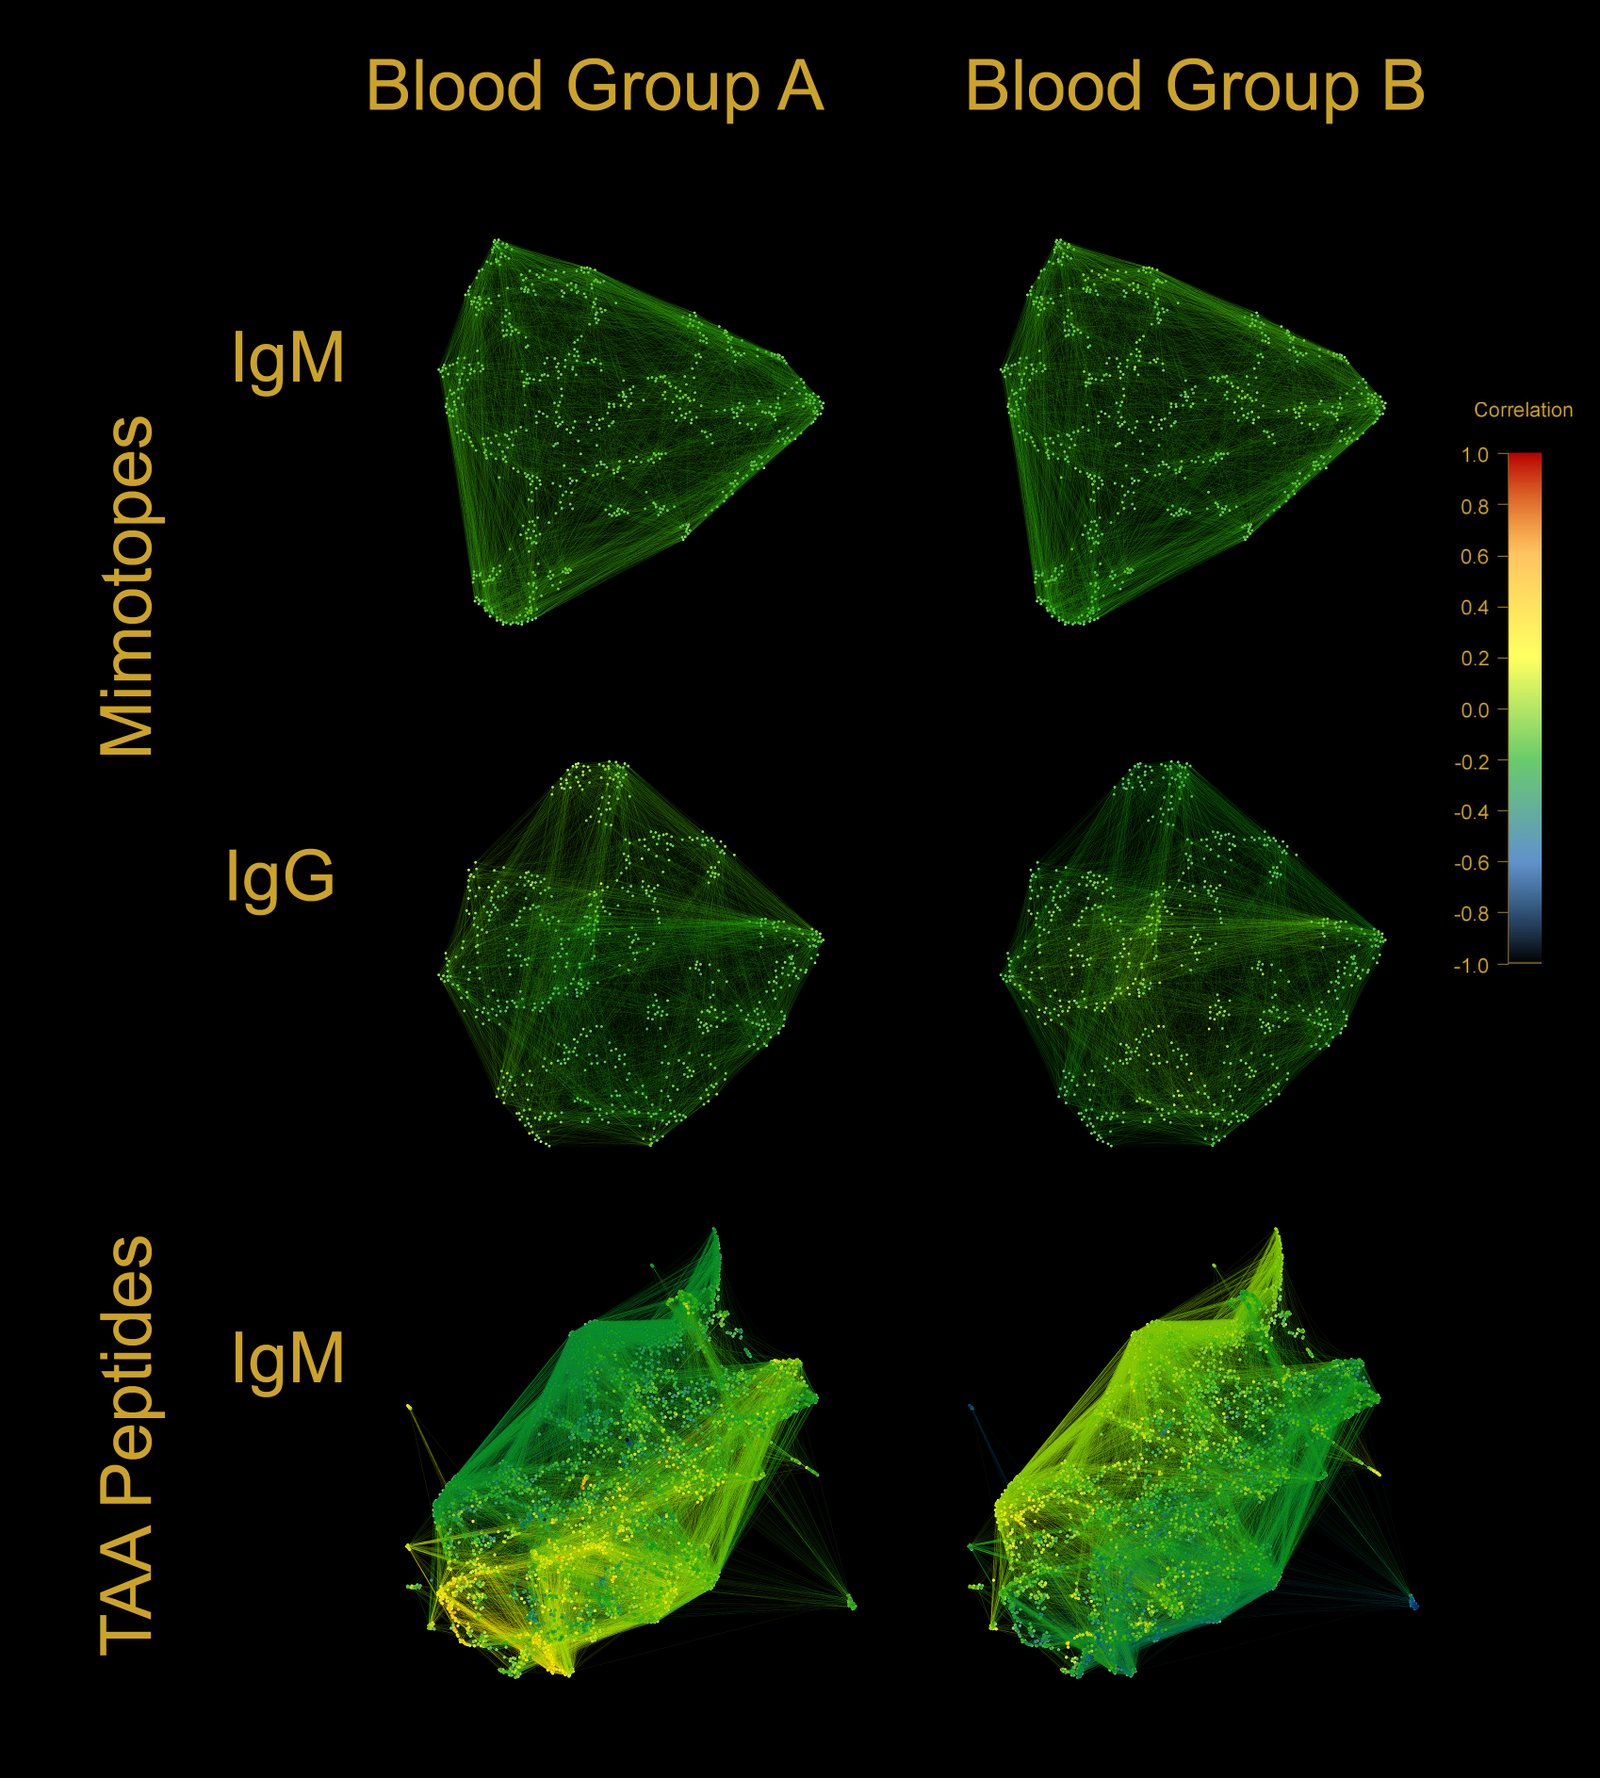
Thus, this co-reactivity graph is a source of information about the repertoire, but it is not a direct measure of cross-reactivity. It is a measure also of co-variation in reactivities across donors, which may be due to shared antigen exposure, shared genetic background (e.g., blood group), or other factors. The biomarkers that can be extracted from this graph are system-level features with complex mechanistic foundation.